The IDR Web Site Report for year 2007
General Summary The General Summary provides a quick overview of the general statistics for
the entire web site during the report time frame.
| General Summary |
|---|
| 1. | Host name | The Immunodeficiency Resource | | 2. | Host URL | http://bioinf.uta.fi/idr/ | | 3. | Program start time | Nov 18, 2008 14:21 | | 4. | Time of first request | Jan 1, 2007 00:04 | | 5. | Time of last request | Dec 31, 2007 23:50 | | 6. | Successful server requests | 259,088 Requests | | 7. | Successful requests for pages | 25,020 Requests for pages | | 8. | Failed requests | 54,354 Requests | | 9. | Redirected requests | 13,818 Requests | | 10. | Distinct files requested | 3,556 Files | | 11. | Distinct hosts served | 19,032 Hosts | | 12. | Total data transferred | 3.681 GB |
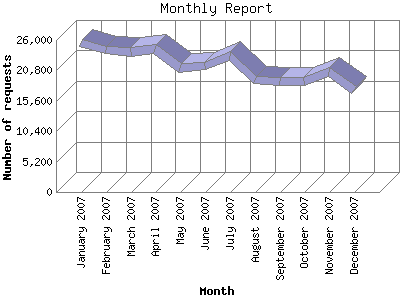
Monthly Report The Monthly Report identifies activity for each month in the report
time frame. Remember that each page hit can result in several server requests
as the images for each page are loaded.
Note: Depending on the
report time frame, the first and last months may not represent a complete
month's worth of data, resulting in lower hits.
| Month | Number of requests | Number of page requests |
|---|
| 1. | January 2007 | 25,535 | 3,711 | | 2. | February 2007 | 24,218 | 2,325 | | 3. | March 2007 | 23,879 | 2,514 | | 4. | April 2007 | 24,386 | 2,131 | | 5. | May 2007 | 21,184 | 2,168 | | 6. | June 2007 | 21,529 | 2,366 | | 7. | July 2007 | 23,180 | 2,495 | | 8. | August 2007 | 19,128 | 1,720 | | 9. | September 2007 | 19,046 | 1,453 | | 10. | October 2007 | 19,007 | 1,576 | | 11. | November 2007 | 20,577 | 1,300 | | 12. | December 2007 | 17,419 | 1,261 |
Most active month January 2007 : 3,711 pages sent. 25,535 requests handled. Monthly average: 2,085 pages sent. 21,590 requests handled.
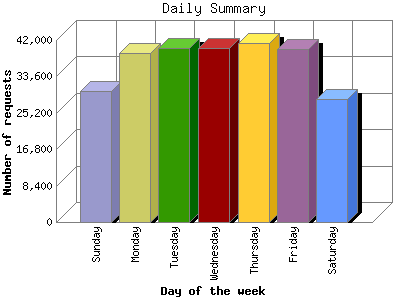
Daily Summary The Daily Summary identifies the level of activity as a total for each day
of the week. This summary also compares the level of activity on weekdays
and weekends as a total for the report time frame.
| Day of the week | Number of requests | Number of page requests |
|---|
| 1. | Sunday | 30,122 | 3,100 | | 2. | Monday | 39,068 | 3,816 | | 3. | Tuesday | 40,151 | 3,776 | | 4. | Wednesday | 40,267 | 4,223 | | 5. | Thursday | 41,226 | 3,692 | | 6. | Friday | 39,817 | 3,667 | | 7. | Saturday | 28,437 | 2,746 | | | Total Weekdays | 200,529 | 19,174 |
|---|
| | Total Weekend | 58,559 | 5,846 |
|---|
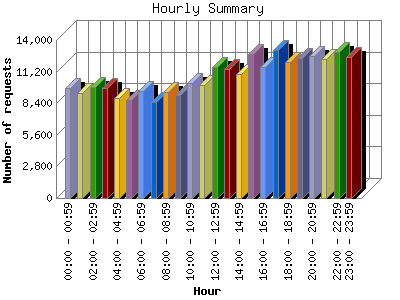
Hourly Summary The Hourly Summary identifies the level of activity broken down by each
hour. Remember that one page hit can result in several server requests as
the images for each page are loaded. This summary also compares the level of
activity during working hours and after hours as a total for the report time
frame.
| Hour | Number of requests | Number of page requests |
|---|
| 1. | 00:00 - 00:59 | 9,708 | 1,016 | | 2. | 01:00 - 01:59 | 9,304 | 911 | | 3. | 02:00 - 02:59 | 9,809 | 945 | | 4. | 03:00 - 03:59 | 9,703 | 881 | | 5. | 04:00 - 04:59 | 8,824 | 922 | | 6. | 05:00 - 05:59 | 8,707 | 856 | | 7. | 06:00 - 06:59 | 9,499 | 931 | | 8. | 07:00 - 07:59 | 8,527 | 786 | | 9. | 08:00 - 08:59 | 9,362 | 917 | | 10. | 09:00 - 09:59 | 9,144 | 899 | | 11. | 10:00 - 10:59 | 10,171 | 988 | | 12. | 11:00 - 11:59 | 9,993 | 967 | | 13. | 12:00 - 12:59 | 11,613 | 1,067 | | 14. | 13:00 - 13:59 | 11,452 | 1,126 | | 15. | 14:00 - 14:59 | 11,005 | 1,042 | | 16. | 15:00 - 15:59 | 12,768 | 1,261 | | 17. | 16:00 - 16:59 | 11,630 | 1,128 | | 18. | 17:00 - 17:59 | 13,078 | 1,376 | | 19. | 18:00 - 18:59 | 12,070 | 1,185 | | 20. | 19:00 - 19:59 | 12,373 | 1,252 | | 21. | 20:00 - 20:59 | 12,577 | 1,154 | | 22. | 21:00 - 21:59 | 12,326 | 1,144 | | 23. | 22:00 - 22:59 | 12,973 | 1,091 | | 24. | 23:00 - 23:59 | 12,472 | 1,175 | | | Work Hours (8:00am-4:59pm) | 97,138 | 9,395 |
|---|
| | After Hours (5:00pm-7:59am) | 161,950 | 15,625 |
|---|
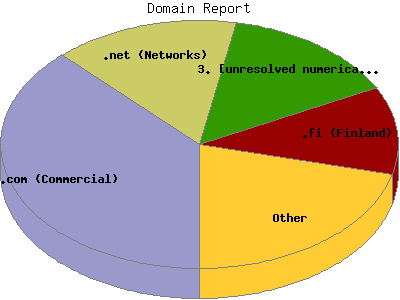
Domain Report The Domain Report identifies the top origins of visitors to this site. This
is determined by the suffix of their domain name. Use this information
carefully as this is based on where their domain name is registered and may
not always be an accurate identifier of the actual geographic location of
this visitor. For example, while most .com domain names are from the United
States, there are a growing number of .com domain names that
exist outside the United States. This report shows all results. This report is sorted by amount of bytes transferred.
| Domain Name | Number of requests | Percentage of the bytes |
|---|
| 1. | .com (Commercial) | 95,350 | 37.80% | | 2. | .net (Networks) | 39,924 | 15.19% | | 3. | [unresolved numerical addresses] | 35,021 | 14.50% | | 4. | .fi (Finland) | 30,916 | 11.44% | | 5. | .edu (USA Higher Education) | 6,103 | 2.44% | | 6. | .jp (Japan) | 3,313 | 1.78% | | 7. | .uk (United Kingdom) | 4,823 | 1.68% | | 8. | .au (Australia) | 4,388 | 1.43% | | 9. | [unknown domain] | 3,646 | 1.39% | | 10. | .es (Spain) | 4,420 | 1.18% | | 11. | .ca (Canada) | 1,740 | 0.94% | | 12. | .de (Germany) | 2,169 | 0.90% | | 13. | .it (Italy) | 1,624 | 0.63% | | 14. | .br (Brazil) | 1,511 | 0.54% | | 15. | .fr (France) | 1,124 | 0.54% | | 16. | .in (India) | 1,469 | 0.53% | | 17. | .cz (Czech Republic) | 1,173 | 0.46% | | 18. | .nl (Netherlands) | 1,372 | 0.45% | | 19. | .org (Non Profit Making Organisations) | 1,425 | 0.43% | | 20. | .pl (Poland) | 1,249 | 0.38% | | 21. | .dk (Denmark) | 713 | 0.34% | | 22. | .ru (Russia) | 1,722 | 0.31% | | 23. | .mx (Mexico) | 604 | 0.27% | | 24. | .tr (Turkey) | 797 | 0.23% | | 25. | .no (Norway) | 527 | 0.20% | | 26. | .my (Malaysia) | 450 | 0.18% | | 27. | .ie (Ireland) | 382 | 0.18% | | 28. | .gov (USA Government) | 415 | 0.18% | | 29. | .se (Sweden) | 489 | 0.17% | | 30. | .pt (Portugal) | 552 | 0.17% | | 31. | .ro (Romania) | 446 | 0.15% | | 32. | .info (Informational) | 305 | 0.14% | | 33. | .be (Belgium) | 300 | 0.13% | | 34. | .sk (Slovakia) | 385 | 0.13% | | 35. | .id (Indonesia) | 633 | 0.13% | | 36. | .us (United States) | 1,106 | 0.12% | | 37. | .ch (Switzerland) | 153 | 0.12% | | 38. | .hu (Hungary) | 334 | 0.12% | | 39. | .gr (Greece) | 589 | 0.11% | | 40. | .lt (Lithuania) | 380 | 0.10% | | 41. | .sa (Saudi Arabia) | 91 | 0.10% | | 42. | .pk (Pakistan) | 328 | 0.10% | | 43. | .nz (New Zealand) | 340 | 0.10% | | 44. | .sg (Singapore) | 237 | 0.09% | | 45. | .il (Israel) | 189 | 0.08% | | 46. | .at (Austria) | 244 | 0.08% | | 47. | .ma (Morocco) | 96 | 0.08% | | 48. | .ar (Argentina) | 264 | 0.08% | | 49. | .za (South Africa) | 227 | 0.08% | | 50. | .hr (Croatia) | 244 | 0.08% | | 51. | .tw (Taiwan) | 219 | 0.07% | | 52. | .co (Colombia) | 251 | 0.06% | | 53. | .cn (China) | 113 | 0.06% | | 54. | .ve (Venezuela) | 83 | 0.06% | | 55. | .si (Slovenia) | 112 | 0.06% | | 56. | .mil (USA Military) | 143 | 0.05% | | 57. | .arpa (Arpanet) | 122 | 0.05% | | 58. | .ph (Philippines) | 140 | 0.05% | | 59. | .eg (Egypt) | 120 | 0.04% | | 60. | .th (Thailand) | 103 | 0.04% | | 61. | .ee (Estonia) | 107 | 0.04% | | 62. | .by (Belarus) | 140 | 0.04% | | 63. | .cl (Chile) | 95 | 0.03% | | 64. | .do (Dominican Republic) | 68 | 0.03% | | 65. | .cu (Cuba) | 56 | 0.03% | | 66. | .yu (Former Yugoslavia) | 66 | 0.03% | | 67. | .sy (Syria) | 63 | 0.03% | | 68. | .uy (Uruguay) | 9 | 0.02% | | 69. | .pe (Peru) | 87 | 0.02% | | 70. | .lu (Luxembourg) | 43 | 0.02% | | 71. | .gt (Guatemala) | 81 | 0.02% | | 72. | .kh (Cambodia) | 13 | 0.02% | | 73. | .gy (Guyana) | 3 | 0.01% | | 74. | .ke (Kenya) | 32 | 0.01% | | 75. | .lb (Lebanon) | 66 | 0.01% | | 76. | .lv (Latvia) | 63 | 0.01% | | 77. | .is (Iceland) | 55 | 0.01% | | 78. | .hk (Hong Kong) | 21 | 0.01% | | 79. | .bg (Bulgaria) | 18 | 0.01% | | 80. | .gm (Gambia) | 6 | 0.01% | | 81. | .ua (Ukraine) | 25 | 0.01% | | 82. | .ae (United Arab Emirates) | 19 | 0.01% | | 83. | [domain not given] | 21 | 0.01% | | 84. | .vn (Vietnam) | 26 | 0.00% | | 85. | .om (Oman) | 14 | 0.00% | | 86. | .md (Moldova) | 5 | 0.00% | | 87. | .ir (Iran) | 28 | 0.00% | | 88. | .py (Paraguay) | 4 | 0.00% | | 89. | .pa (Panama) | 11 | 0.00% | | 90. | .kr (South Korea) | 11 | 0.00% | | 91. | .mt (Malta) | 6 | 0.00% | | 92. | .ge (Georgia) | 31 | 0.00% | | 93. | .tv (Tuvalu) | 4 | 0.00% | | 94. | .biz (Businesses) | 6 | 0.00% | | 95. | .na (Namibia) | 6 | 0.00% | | 96. | .gh (Ghana) | 13 | 0.00% | | 97. | .ba (Bosnia-Herzegovina) | 5 | 0.00% | | 98. | .int (International Treaty Organisations) | 9 | 0.00% | | 99. | .an (Netherlands Antilles) | 3 | 0.00% | | 100. | .ag (Antigua and Barbuda) | 8 | 0.00% | | 101. | .cy (Cyprus) | 5 | 0.00% | | 102. | .ec (Ecuador) | 4 | 0.00% | | 103. | .mm (Myanmar) | 5 | 0.00% | | 104. | .zm (Zambia) | 4 | 0.00% | | 105. | .am (Armenia) | 2 | 0.00% | | 106. | .je (Jersey) | 1 | 0.00% | | 107. | .bj (Benin) | 2 | 0.00% | | 108. | .mu (Mauritius) | 1 | 0.00% | | 109. | .ad (Andorra) | 2 | 0.00% | | 110. | .mw (Malawi) | 2 | 0.00% | | 111. | .ni (Nicaragua) | 1 | 0.00% | | 112. | .jm (Jamaica) | 1 | 0.00% | | 113. | .pg (Papua New Guinea) | 1 | 0.00% | | 114. | .bs (Bahamas) | 1 | 0.00% | | 115. | .ci (Ivory Coast) | 1 | 0.00% |
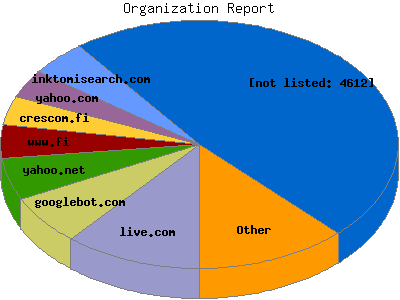
Organization Report The Organization Report attempts to list the organizations (companies,
institutions, ISPs etc.) whose computers accessed your site. In general
this is similar to the Domain report but shows the servers one level up
in the name-tree. This report can also show a hierarchy of servers within
an organization. For example aol.com has many proxy-nnn.aol.com servers. This report shows the first 20 results by number of requests. This report is sorted by number of requests.
| Organization | Number of requests | Percentage of the bytes |
|---|
| 1. | live.com | 32,673 | 11.14% | | 2. | googlebot.com | 18,826 | 6.52% | | 3. | yahoo.net | 12,882 | 5.59% | | 4. | www.fi | 12,243 | 4.28% | | 5. | crescom.fi | 10,621 | 3.74% | | 6. | yahoo.com | 9,520 | 3.70% | | 7. | inktomisearch.com | 8,342 | 4.64% | | 8. | comcast.net | 4,534 | 1.73% | | 9. | msn.com | 4,113 | 1.59% | | 10. | [unknown domain] | 3,705 | 1.58% | | 11. | rr.com | 3,595 | 1.28% | | 12. | uta.fi | 3,301 | 1.51% | | 13. | ntl.com | 2,501 | 0.89% | | 14. | verizon.net | 2,214 | 0.69% | | 15. | 59 | 2,143 | 0.37% | | 16. | uco.es | 2,045 | 0.33% | | 17. | rima-tde.net | 1,956 | 0.43% | | 18. | ono.com | 1,797 | 0.62% | | 19. | hiit.fi | 1,746 | 0.66% | | 20. | aol.com | 1,691 | 0.63% | | | [not listed: 4612] | 118,640 | 48.08% |
Operating System Report The Operating System Report lists the operating system your visitors are
running for visitors whose browser types you know. Not all browsers provide
this information and not all visitors provide browser information, but what
is provided, is summarized here. This report shows all results. This report is sorted by number of requests for pages.
| Operating System | Number of requests | Number of page requests |
|---|
| 1. | OS unknown | 126,555 | 12,371 | | 2. | Windows | 122,319 | 11,643 | | | Windows XP | 104,268 | 9,606 | | | Windows 2000 | 10,398 | 1,305 | | | Unknown Windows | 4,407 | 302 | | | Windows 98 | 1,427 | 183 | | | Windows 95 | 163 | 103 | | | Windows Server 2003 | 1,160 | 76 | | | Windows ME | 319 | 35 | | | Windows NT | 157 | 30 | | | Windows CE | 20 | 3 | | 3. | Macintosh | 5,746 | 543 | | 4. | Unix | 2,985 | 160 | | | Linux | 2,947 | 160 | | | SunOS | 9 | 0 | | | BSD | 29 | 0 | | 5. | Symbian OS | 18 | 3 | | 6. | WebTV | 5 | 1 | | 7. | Palm OS | 5 | 0 | | 8. | Amiga | 1 | 0 |
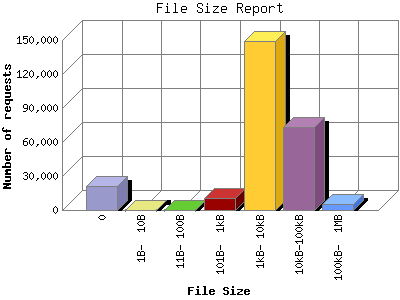
File Size Report The File Size Report categorizes the size of the file being requested. This
can be useful in optimizing site performance. (Remember that on a 28.8Kps
modem, it will take on average of 40 seconds to download 100Kb of data.)
| File Size | Number of requests | Percentage of the bytes |
|---|
| 1. | 0 | 20,955 | 0.00% | | 2. | 1B- 10B | 26 | 0.00% | | 3. | 11B- 100B | 4 | 0.00% | | 4. | 101B- 1kB | 10,199 | 0.08% | | 5. | 1kB- 10kB | 148,800 | 23.50% | | 6. | 10kB-100kB | 73,530 | 40.41% | | 7. | 100kB- 1MB | 5,574 | 36.01% |
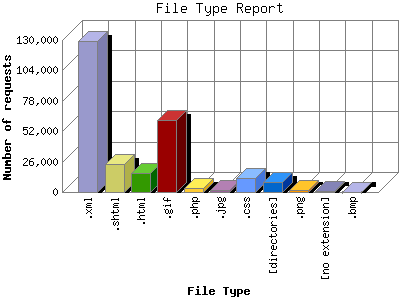
File Type Report The File Type Report identifies the type of information that is requested from
the web site. GIF and JPG are the two types of graphic (image) files that are
most commonly supported by web browsers. HTML (sometimes abbreviated HTM), ASP,
and [directories] all represent actual pages. The number of image requests will
almost always outnumber page requests as one page may contain several images. This report shows results with at least 0.100000 percent of the total bytes. This report is sorted by amount of bytes transferred.
| File Type | Number of requests | Percentage of the bytes |
|---|
| 1. | .xml | 128,991 | 55.91% | | 2. | .shtml | 24,321 | 25.11% | | 3. | .html | 16,420 | 8.96% | | 4. | .gif | 61,224 | 4.37% | | 5. | .php | 3,262 | 2.38% | | 6. | .jpg | 1,945 | 1.88% | | 7. | .css | 11,696 | 0.49% | | 8. | [directories] | 8,600 | 0.39% | | 9. | .png | 1,768 | 0.21% | | 10. | [no extension] | 479 | 0.14% | | 11. | .bmp | 211 | 0.11% | | | [not listed: 6] | 171 | 0.04% |
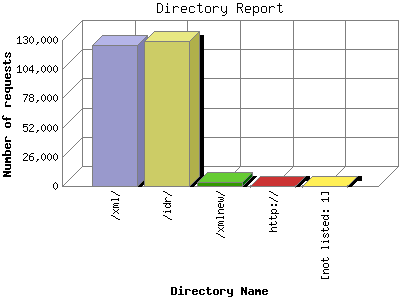
Directory Report The Directory Report analyzes accesses to this web site's directories. This
information can be useful in determining the most requested areas. This report shows results with at least 0.010000 percent of the total bytes. This report is sorted by amount of bytes transferred.
| Directory Name | Number of requests | Percentage of the bytes |
|---|
| 1. | /xml/ | 125,806 | 54.90% | | 2. | /idr/ | 129,383 | 43.74% | | 3. | /xmlnew/ | 3,840 | 1.34% | | 4. | http:// | 53 | 0.02% | | | [not listed: 1] | 6 | 0.00% |
This report was generated on November 18, 2008 14:21.
Report time frame January 1, 2007 00:04 to December 31, 2007 23:50.
|

